Myriad Desktop
Introduction
Myriad Desktop is a desktop application that provides an easy to use graphical user interface for scanning datasets for Regions of Interest (ROI) built on the Myriad fault-tolerant data reduction framework. A video demonstrating the use of Desktop is available from Emphysic's Wistia page or the main Myriad page.
The desktop tool employs the pipeline parallelism [1] methodology to parallelize data processing, in which an extensive computation is broken down into a series of independent concurrent steps or stages. Since each stage operates concurrently, the total throughput of the system (measured in iterations per unit time) is determined by the slowest stage in the pipeline.
Each stage is configured as a “router” with a configurable number of workers. When a stage receives a work order, the router adds the work to a shared queue. The next available worker grabs the next work order from the queue and begins processing. If the worker successfully completes the work, it sends the results back to the router which then sends the results to the next stage in the processing pipeline.
A work order is only removed after the work is successfully completed, so if the operation fails during processing the next available worker simply restarts the job. Since each stage is independent, in the event of failure only the immediate task in the current stage is lost. No other part of processing is affected.
Stages are designed in Myriad Desktop to work from left to right, e.g. in a standard pipeline data are first read and then sent to the Gaussian Pyramid router, which sends its results to the Sliding Window router when complete, etc. Each stage is optional so that if Gaussian Pyramid operations are not required for example data can be directly sent to the Sliding Window router instead.
Installation
The Myriad library must be installed prior to building Trainer. Please refer to the main Installation page for details on installing Myriad, Myriad Desktop, and Myriad Trainer.
Quick Start
We've prepared a bundle to help you get started. Inside is a model that has been trained to find indications of structural damage in sensor data and some sample input files to get you started. Download the bundle and extract the model and the sample files in a convenient location, then use them as you proceed through the documentation.
When you're ready to create your own ROI models, have a look at the companion tool Myriad Trainer.
Constructing A Pipeline
Configuration
The first step in constructing a processing pipeline is configuring each stage of the pipeline. Start by selecting each of the stage tabs in turn and reviewing their default settings. If these values are acceptable, the entire pipeline can be constructed at once by pressing Construct Pipeline. If you want to adjust the number of workers in the stage or stage-specific options, you can make the adjustments and then press Configure Stage. Note that it is not necessary to restart Desktop or rebuild the pipeline after you configure a stage as it automatically replaces any previously-configured stage.
A video that discusses the various processing stages and walks through configuration is available:
Concurrency Considerations
By default Desktop uses 10 workers per configured stage, but you may also wish to experiment with these values.
For large (many files and/or big files) datasets, you may want to consider reducing the number of workers used in the Data Ingestion and Scale Space stages. Data must be read and kept in system memory before subsequent stages can perform their work, and as such if the subsequent stages are the bottlenecks in your pipeline you could be wasting RAM and CPU cycles holding data in memory long before it can be processed. Emphysic has had success with a power-of-two approach in which the number of workers in a stage is two times the number of workers in the previous stage. Thus if 2 workers are used to read data, 4 are used for pyramid, 8 for sliding window, 16 for ROI, and e.g. back to 8 for reporting. This approach is based on the observation that a typical processing pipeline creates additional work as one moves through stages.
- Reading a single file requires one available worker in the Scale Space stage. However, reading operations are typically much faster than pyramid operations, and as such Scale Space typically requires a larger pool of available workers.
- As the file is resized at each step in the Scale Space operation, each resized step can consume a single pre-processing operation. Depending on the computational complexity of the preprocessing it can be slower than the pyramid operation, and as such this stage typically requires a larger pool of available workers.
- Sliding Window operations are typically among the fastest operations in the processing pipeline unless extensive per-window processing is configured and/or the pool of ROI detectors is the processing pipeline’s main bottleneck. Since the window stage does not consume resources when not in use it would typically be configured to be as least as large as the preceding stage.
- ROI detection is frequently the most computationally-intensive part of the processing pipeline as it typically has the most complicated operations and the most data to process. A sliding window from the previous stage is typically configured to hand off the data to the ROI pool and continue sliding across its own data, so the ROI detection pool should be larger than the window pool to ensure that a worker is usually available.
- The results reporting stage is normally the same size or smaller than the ROI pool, as its computational complexity is low.
If an external ROI detection application has a long startup time e.g. if loading a model from disk or startup costs for a virtual machine, consider increasing the number of workers in the ROI Detection stage to a larger number e.g. 20, 64, or 256. Although each individual worker in the ROI pool will still take a long time to start and finish its work, the increased number of available workers means that preceding stages aren’t waiting for an available worker to complete their own work.
Oversubscription
What happens if the number of workers configured in a processing pipeline is greater than the number of threads available on the system? Myriad uses the Akka concurrency framework, and as such the Myriad workers (referred to as Actors in Akka) are lighter than CPU threads. In general depending on the workload you can have many times more workers than any system’s number of CPUs.
If the workers are performing computationally-intensive tasks as is often the case in image and signal processing however, it is still possible to use 100% of the available cores (referred to as “pegging the CPU”). The responsiveness of the system may or may not be impacted depending on the amount of RAM being used. Anecdotally, a hexacore system with 32GB of RAM can run a pipeline with more than 100 workers and still be used for other applications.
Pegging the CPU has been found in some applications to be a valid throughput optimization technique, referred to as “oversubscription” [2]. When constructing a data processing pipeline it can be difficult or impossible to know for certain which stage will be the bottleneck. When a pipeline is constructed, the user is using their experience and intuition to set a static configuration. If their intuition is wrong, overall system throughput will be limited as one or more stages are starved of resources or waiting for other stages to complete.
Oversubscription is the process by which a pipeline constructor deliberately chooses a number of workers much greater than the number of available cores (e.g. 3-4x as many in [3]). This will guarantee that the CPU will be pegged and will invoke the operating system’s task scheduler, and in effect acts as an easy-to-use dynamic load balancer. A tremendous amount of resources are spent optimizing an operating system’s context switcher as it has a very large impact on the performance of the operating system as a whole. As a result, the operating system is likely in the best position to know exactly where and how resources should be committed. The work detailed in [3] indicated that oversubscription can greatly outperform non-oversubscribed pipelines: a single core running 6 processes was found to provide nearly the same throughput as a 6 core / 6 process configuration.
Remoting
Myriad and by extension Desktop also supports ad-hoc distributed pipelines in which instead of running one or more processing stages locally, the tool makes calls to other systems in a process known as remoting. Developers interested in building large-scale distributed processing clusters can use Myriad the library directly, but Desktop provides a convenient mechanism for smaller deployments. The basic steps in setting up a distributed Myriad Desktop network are summarized below; a video demonstrating the procedure is also available.
To build a distributed pipeline, start Myriad Desktop (or another Myriad-based application) on each system to be used in the pipeline. Note that Desktop can make remoting calls to any other Myriad application including "headless" deployments on servers, but for the purposes of this demonstration we'll assume that both systems are running Desktop.
On the remote system, start the processing stage(s) it will be responsible for by pressing the Configure Stage button. The system will update with the (local) path to the stage. This path, in combination with remoting details found in the About dialog, makes up the remote URL of the stage. Note that it is only necessary to configure the stage(s) that will be used on the remote system, i.e. do not configure the entire pipeline or start processing on the remote machine.
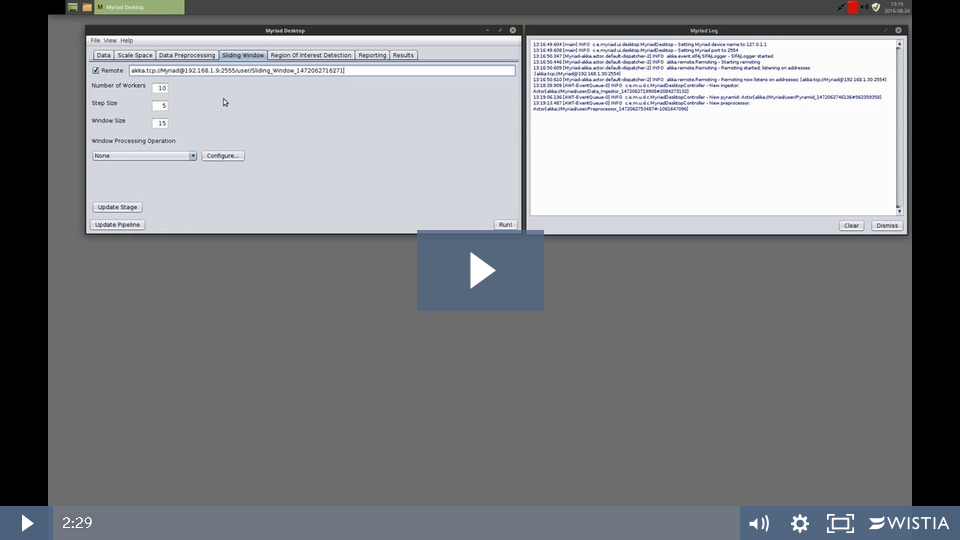
On the “local” (i.e. the system that will call this remote stage) system, browse to the appropriate tab in Desktop and ensure the Remote checkbox is checked. Enter the remote system’s IP address and Myriad port (available from the remote system’s About dialog), and enter the stage’s path. Note that the format of a remote processing stage URL is of the form
akka.tcp://Myriad@<remote system IP>:<remote system port>/user/Remote_Stage_Name
as shown in this figure:

When using a remote stage none of the local configuration options are applicable - simply press the Configure Stage button to have the local copy of Desktop attempt to contact the remote copy to build the stage. The local system’s stage path will update as we are now treating the remote system’s processing stage no differently than a local process. The remote system doesn’t need to know where its inputs come from, and subsequent stages in our local system don’t need to know anything about the remote system as they use this local “relay” Myriad constructs for this purpose.
To verify communications have been established, open the realtime log windows on both the remote and the local systems (View Log). On the remote system a message should be displayed indicating it received and accepted a request for a connection. On the local system a similar message should be displayed indicating a remote call was made and a connection returned.
Troubleshooting
If the connection did not succeed or if the connection is lost, the local system will begin attempting to reconnect by calling the remote system every few seconds. If the remote system’s stage URL was correctly entered the most common problem in remoting is being blocked by an anti-virus / firewall application. Consult your AV system’s help for assistance on opening the ports required for the connection (you’ll need to open the ports specified in the About dialog).
Stages
A discussion of each of the stages in the Myriad Desktop application follows. If you're comfortable with reading Java code, Emphysic has posted a sample Myriad application that approximates Desktop's processing pipeline as a single-threaded application which may be helpful in understanding the basic approach to ROI detection.
Data Ingestion
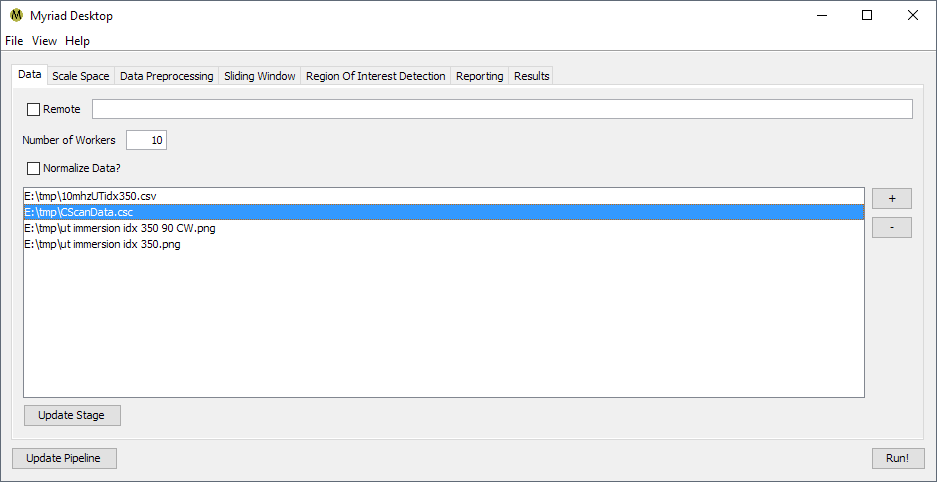
The Data Ingestion stage is responsible for reading the input data. Prior to starting execution, the pipeline user adds one or more data files to the list for ingestion. The data files must be in a file format recognized by Myriad: as of this writing this includes
- Delimited text files such as CSV
- Bitmaps such as GIF, JPEG or PNG
- DICOM / DICONDE
In addition to the standard stage configuration options for remote/local operation and the number of workers, Data Ingestion has an option for automatically normalizing data. When enabled, data are normalized such that all values are between 0 and 1. Normalization is particularly useful when data sources may have different scales, e.g. when analyzing data saved as images.
When the pipeline is executed, the Data Ingestion router builds a list of the data files to be read. When a worker is ready, it takes the next job off the queue. The worker uses Myriad’s “file sniffer” functionality to attempt to automatically determine the type of file and to read its contents, e.g. files that end in .txt are first examined as possible text files and Myriad attempts to determine the most likely delimiter (comma, whitespace, etc.). If successful data from the file is read, normalized if configured to do so, and passed to the next stage. For multi-frame file formats such as GIF, TIFF, or DICOM/DICONDE, the worker will attempt to read each frame and send to the next stage.
If the file could not be read, the worker makes a log entry that includes the name of the file that could not be read and the nature of the error encountered.
After sending the file’s data to the next stage in the pipeline or logging an error if the file could not be read, the worker returns to the job queue to look for the next job.
Scale Space
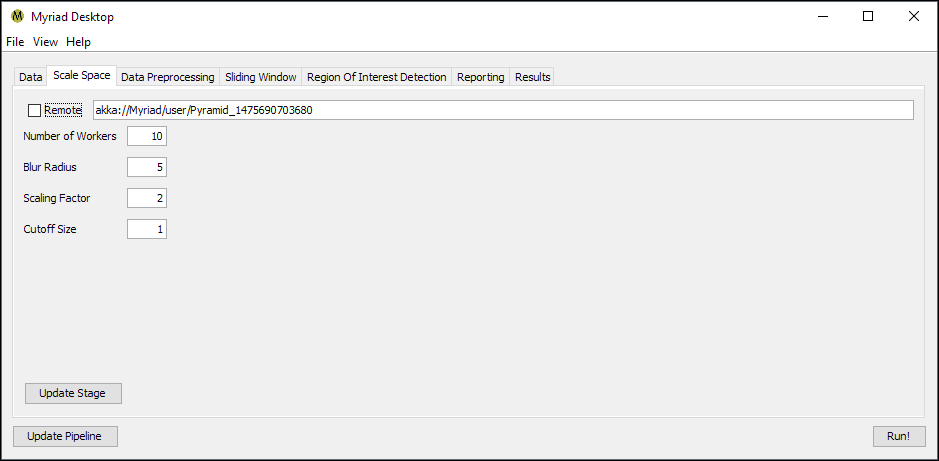
The Scale Space stage is responsible for performing the Pyramid operation on incoming data, in which data is reduced in size and blurred in repeated steps. The purpose of this stage is to eliminate the need for the ROI detection code to consider the scale of input data: without this scale invariance an ROI detection algorithm may not have any means of considering data outside its configuration. For example, a detector trained to look at 100x100 element samples might otherwise miss an indication that was 300x300.
In addition to the standard stage configuration Scale Space has several additional options.
- Blur Radius. The radius in points of the blur operation performed. The total width of the Gaussian blur kernel is then 2r + 1.
- Scaling Factor. The reduction factor between steps in the pyramid operation, typically set to 2 so that each step is ½ the size of its predecessor.
- Cutoff Size. The lower limit on the size of a step in the pyramid operation. When the current step is less than or equal to this size in each dimension, the pyramid operation completes for this input. Typically set to 1 so that the pyramid operation will continue on an incoming dataset until the step is 1x1 points.
Preprocessing
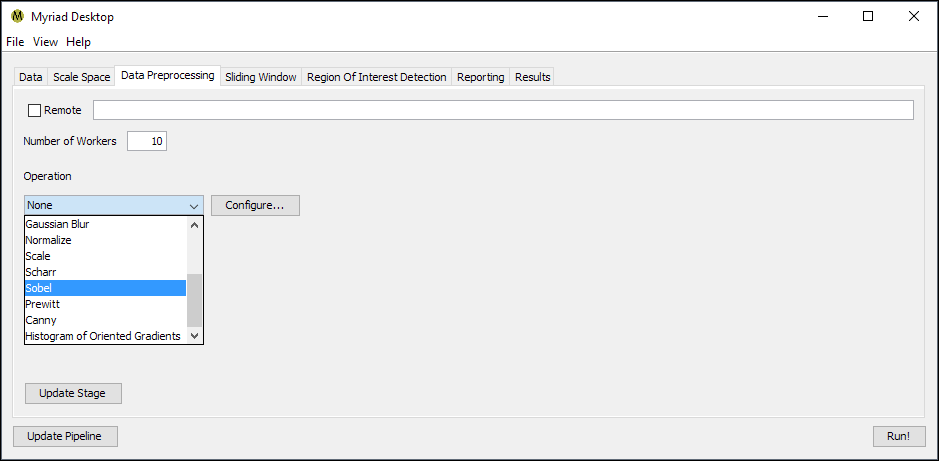
The preprocessing stage is used to apply a global operation to each dataset, such as blob detection or normalization. The only configuration option available for this stage is to specify an operation to perform, which in turn must also be configured by pressing the Configure button.
By default no preprocessing is performed. The Sliding Window stage can optionally perform the same operations but on a local instead of global scale. This might be preferable e.g. for computationally expensive preprocessing operations that would otherwise dramatically impact pipeline throughput. Some operations may take on a different context depending on whether they are performed at the global or the local scale, e.g. operations which rely on means and standard deviations may have entirely different effects depending on where they are applied.
Sliding Window
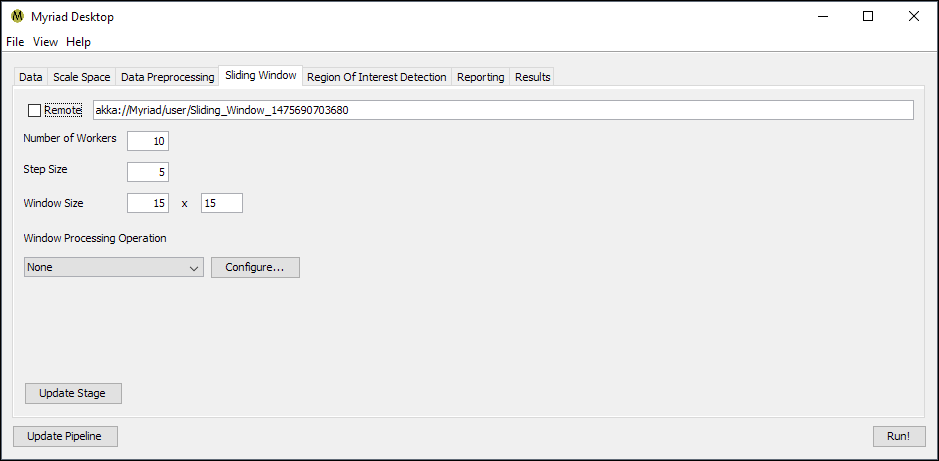
The purpose of the Sliding Window stage is to produce subsets of incoming data for the subsequent ROI detection stage. As a result, if the ROI detection stage expects a particular size of data as is the case with machine learning models, the Sliding Window must be configured to use the same size.
- Step Size. The increment in points between windows, e.g. a setting of 5 means that the next window will be offset by 5 points from the start of the current window. If this size is smaller than the size of the window, this will result in overlapping windows. Similarly if the step size is greater than the size of the window there will be gaps between windows. The more overlap between windows the less likely ROI will be missed as each region will be considered multiple times, however this also results in increased computational costs. One approach is to start with a coarse slide through data where the step size is ~ the same as window size, then stepping down in subsequent analyses for a finer examination.
- Window Width and Window Height. The size of the window in points. If the ROI detector expects a specific number of points per input, the window size must match this setting. Example: if a model is trained used 15x15 samples, the window size should be set to 15x15.
- Window Processing. As discussed in the Preprocessing Stage, the Sliding Window stage is able to perform the same preprocessing operations on the local scale i.e. each window is preprocessed before sending to the ROI detector. Depending on your application and the complexity of the preprocessing you may be able to increase pipeline throughput by performing preprocessing on individual windows rather than the global dataset.
Region Of Interest Detection
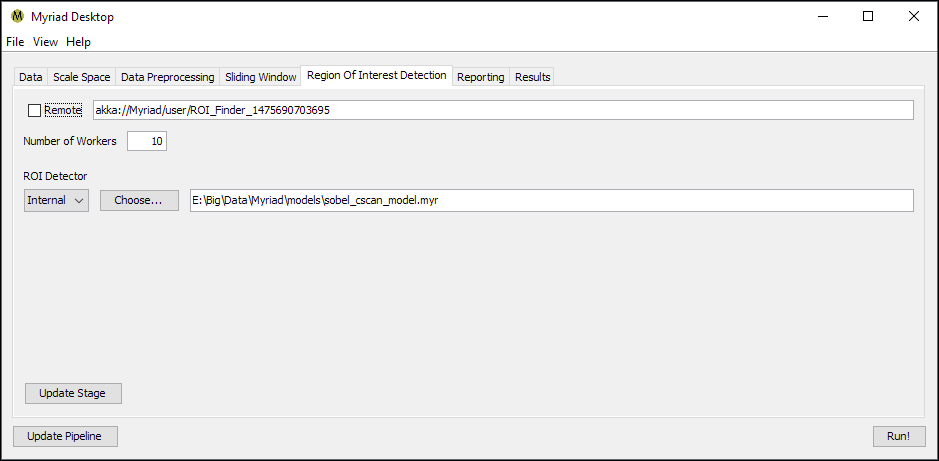
The Region Of Interest Detection stage is responsible for examining data for ROI. When the stage receives data, it is sent to a worker that runs an instance of Myriad’s ROIFinder class. The ROIFinder class’ isROI() method is called, and if the ROIFinder reports true the worker reports that a Region Of Interest was found within its data.
Internal ROI Finder
As of this writing this stage has only one option, used to configure the ROIFinder type and path. If the ROIFinder is “internal,” this refers to a Myriad model previously saved with Myriad Trainer or similar custom code. When the stage is constructed / updated, this internal model is read from storage and an identical copy provided to each worker in the pool.
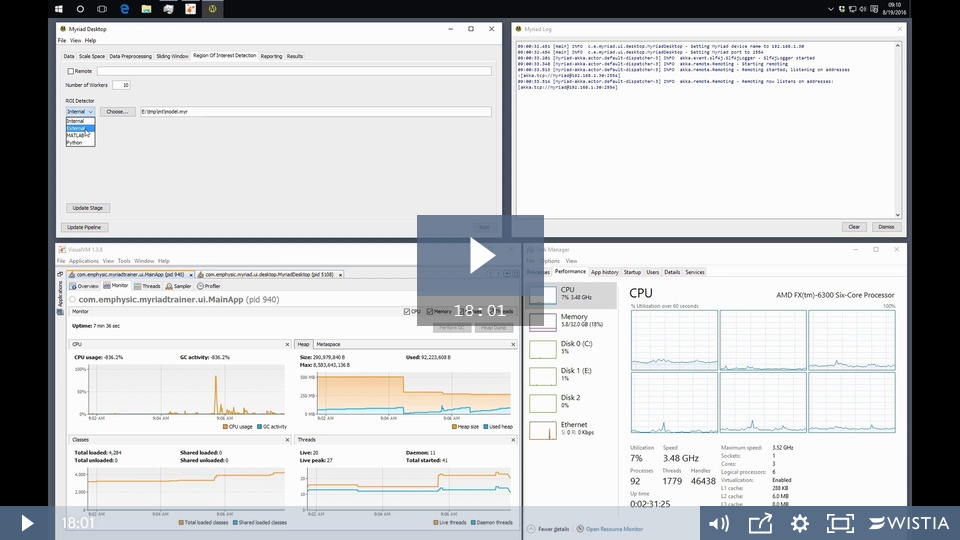
External ROI Finder
The second supported type of ROIFinder is “external,” which is broken into three sub-types for convenience.
Python

For Python scripts, Desktop will ask for the full path to a Python binary and then for the Python application. This will result in a path to the ROIFinder of the form /path/to/python /path/to/python_script [command line arguments] e.g.
C:\Users\chris\Anaconda3\python.exe C:\Users\chris\PycharmProjects\myriad_datagen\cscan_flawfinder.py
MATLAB

For MATLAB scripts, Desktop will construct a command line that executes the script without displaying the MATLAB user interface e.g.
E:\Apps\MATLAB\R2016a\bin\matlab.exe -nodisplay -nosplash -nodesktop -r "run('C:\Users\chris\nditoolbox.m);exit;"
General External

For all other external scripts Desktop will ask for the full path and filename of the external application. Note that there is no functional difference between MATLAB, Python, or any other external ROIFinder - Desktop provides some convenient shortcuts for Python and MATLAB but otherwise they are identical to every other external process.
Desktop uses Myriad’s ExternalProcess class to control and communicate with external applications. ExternalProcess is an easy to use process handler that assumes the external application accepts command line arguments: when a worker receives data it starts the external application with the command
/path/to/external/application [received data]
Where the path is the path as shown in Desktop (including paths to Python, MATLAB or another interpreter) and [received data] is every element in the received data, separated by whitespace. Thus if the worker received a 2x2 array it would make a call of the form
/path/to/external/application i11 i12 i21 i22
Under The Hood
The worker then listens to the standard output of the external application. All lines that do not begin with
myriad:are ignored; a line that begins withmyriad:and containstrue,TRUE, etc. is assumed to indicate a Region Of Interest was found in the data, i.e.myriad: truefor ROI andmyriad: falsefor no ROI.
REST ROI Finder
The third type of ROIFinder supported in Desktop is “REST,” which is used to contact a representational state transfer web service via Myriad's RESTROIFinder class. When a REST ROIFinder is selected, Desktop will open the Configure REST Client dialog from which the REST API endpoint and (optional) authentication credentials are entered.
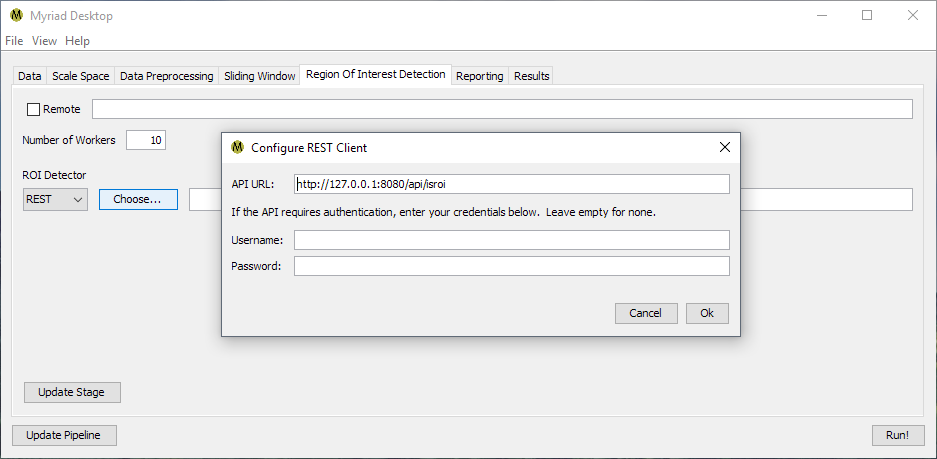
By default the RESTROIFinder sends a PUT request of the form
[url]?data=WzIzLjM3OTY4MDI4NjA3ODc3NCw5LjQyNzQ3NzQzNDk1M...
where [url] is the specified API URL and the data to be checked for ROI are encoded and sent as the data parameter. RESTROIFinder expects the server to return a JSON object of the form
{'isROI': boolean}
where the isROI value should be true if the API classifies this data as containing an ROI and false otherwise. Basic authentication is supported by specifying a username and a password; if both fields are empty no authentication is used.
REST API Service Example
If you have access to Emphysic's myriad_datagen project, the server.py file shows an example of a simple ROI service written in Python using the Bottle web framework:
#!/home/ccoughlin/anaconda3/bin/python


"""server - demonstrates running a REST-based API for making Region of Interest (ROI) calls for the Myriad
data reduction framework.

 Chris R. Coughlin (Emphysic)
 Copyright (C) 2016 Emphysic LLC.  All rights reserved.
"""

from service.bottle import route, run, request, response
from ml import cscan
import numpy as np
import argparse
import base64
import json

clf = cscan.load_model("cscan_demo")


@route('/api/isroi', method='POST')
def isroi():
    """
    Calls the model and returns whether the model predicts the input data contains a Region of Interest or not.  Data
    are expected as POST requests with Base64-encoded array e.g. calls of the form

    POST host:port/api/isroi?data=WzIzLjM3OTY4MDI4NjA3ODc3NCw5LjQyNzQ3NzQzNDk1M...

    :return: JSON object of the form {'isROI': boolean}
    """
    response.content_type = "application/json"
    decoded_data = base64.b64decode(request.params.data)
    data = json.loads(str(decoded_data, 'utf-8'))
    arr = np.array(data)
    prediction = np.asscalar(clf.predict(arr.reshape(1, -1))[0]) == 1
    return {'isROI': prediction}

if __name__ == "__main__":
    parser = argparse.ArgumentParser()
    parser.add_argument('--host', default='localhost',
                        help='Specifies the IP address the server listens to (default localhost)')
    parser.add_argument('--port', default=8080,
                        help='Specifies the port the server listens to (default 8080)')
    args = parser.parse_args()
    run(host=args.host, port=args.port)
Note that the simple single-process server shown here is useful for development purposes, but a production server should be able to handle multiple simultaneous connections and may additionally require load balancing. If the number of RESTROIFinder requests overwhelms the server, you may begin to receive "connection refused" errors in the Desktop log.
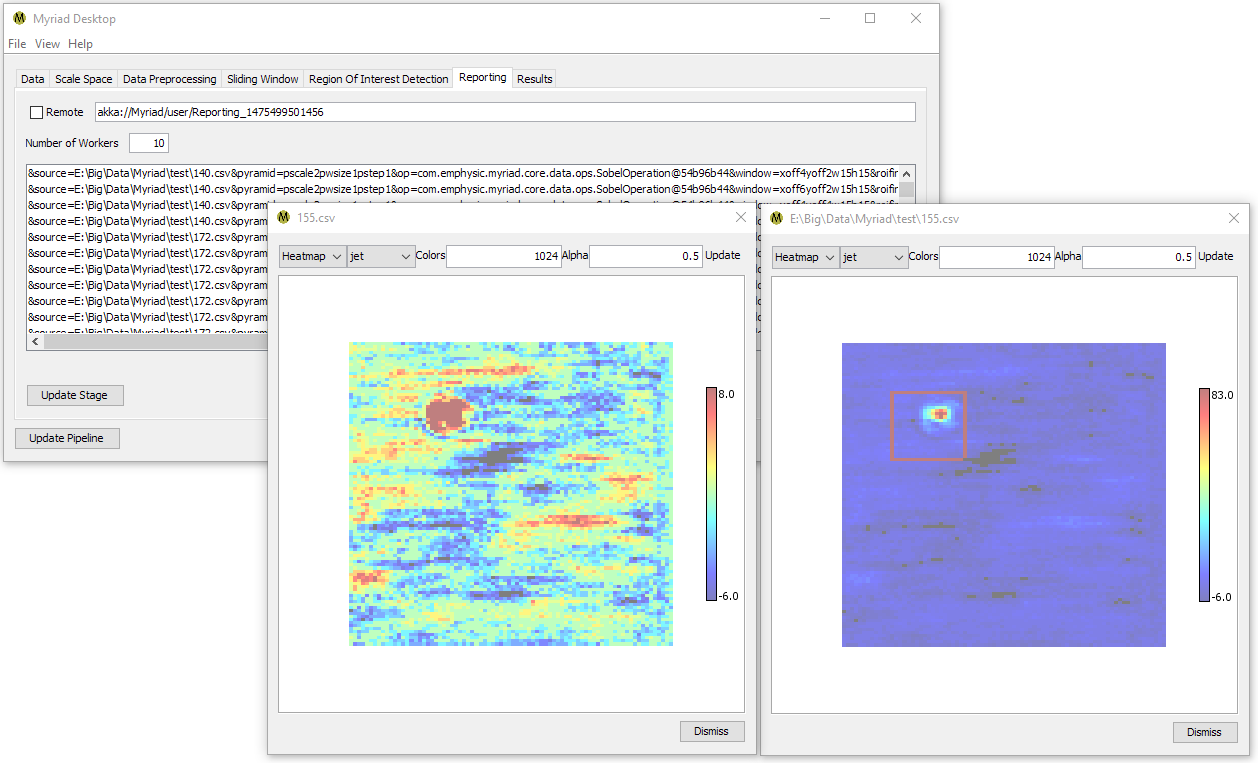
Reporting
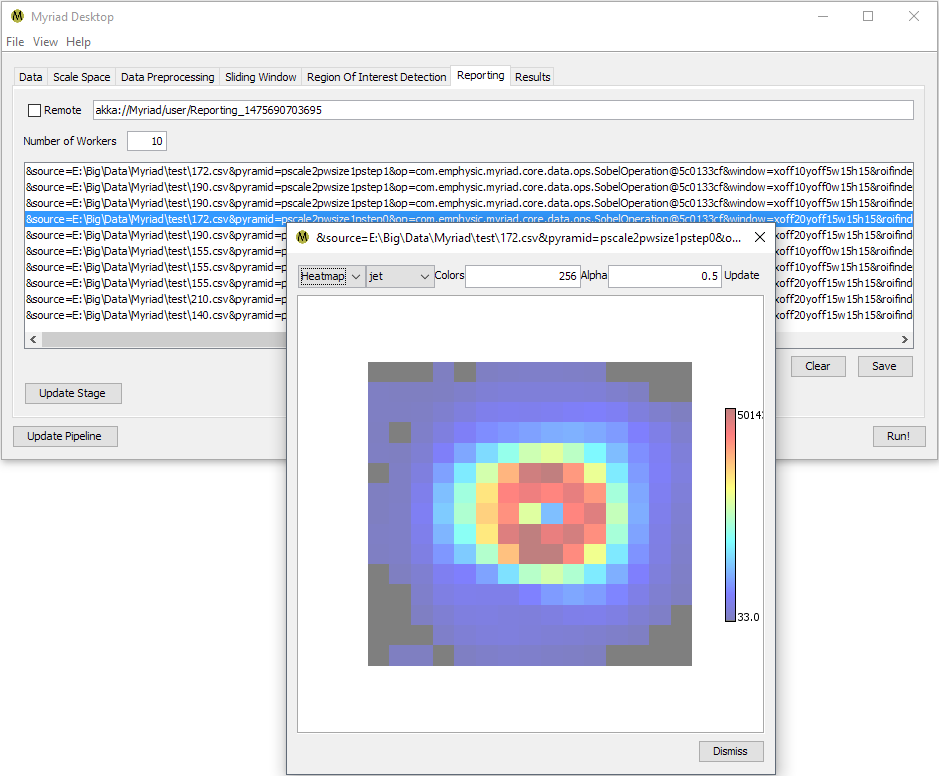
Regardless of the type of ROIFinder used, when the pipeline is used to process data Desktop will keep a list of the Regions Of Interest found during the current run. In Myriad, an ROI is essentially a container for the data passed to the ROIFinder and associated metadata. In Desktop, the metadata consists of a string of key-value pairs that among other details include the filename of the source data, the type of preprocessing (if any) performed on the input data, the position of the sliding window relative to the original data, and the name of the ROIFinder used to inspect the data.
Double-clicking on any ROI in the list will display the ROI’s data. This is the data the ROIFinder “sees” after preprocessing and which it uses to determine if an ROI is present. If a sophisticated preprocessing technique such as Histogram of Oriented Gradients (HOG) was used, this data may not look like an ROI to the human eye. If a simpler preprocessor was used, or if no preprocessing was performed, the data is more likely to resemble ROI to an observer.
In many cases, the number of ROI found will greatly exceed the actual number of ROI within a set of data as one ROI may be detected multiple times. This is due to the fact that when using a Gaussian pyramid in conjunction with sliding windows, Myriad is actually considering the same subset of data multiple times. Desktop provides several alternatives for simplifying the display of ROI, please refer to the Processing Data section of this document for more details.
The exact number of multiple detections will vary depending on the size of the original data, the size of the ROI relative to the data, and the step size used in the sliding window stage. Desktop’s Results tab is used to compile the final results and offers multiple options for reducing the number of ROI seen in the data.
Processing Data
Once each stage of the processing pipeline has been configured, Desktop can begin to process input data. On the Data tab, press the + button to add one or more input data files to the list for analysis. As mentioned in Stages, any file format recognized by Myriad can be used here. When the Run! button is pressed, each of these files will be read and processed by Desktop.
To monitor progress, open the log window prior to beginning analysis. Log entries will be appended to the window in real time as data make their way through the pipeline. In addition, switching to the Reporting tab will show ROI as they are received.
Results
The Results tab is a post-processing option that is not configured as part of the processing pipeline. Please refer to Processing Data for details.
Running The Pipeline
To execute the pipeline, ensure that each stage you wish to use has been properly configured. A stage has been configured if its Path contains an Akka URL e.g.
Stages that don't have an Akka URL have not been configured and will not run. The first stage on its left that has been configured will then pass its data directly to the first stage on its right that has been configured. For example, configuring the Data Preprocessing stage would normally result in a data flow of Scale Space --> Preprocessing --> Sliding Window. If no preprocessing has been configured the pipeline's data flow is Scale Space --> Sliding Window.
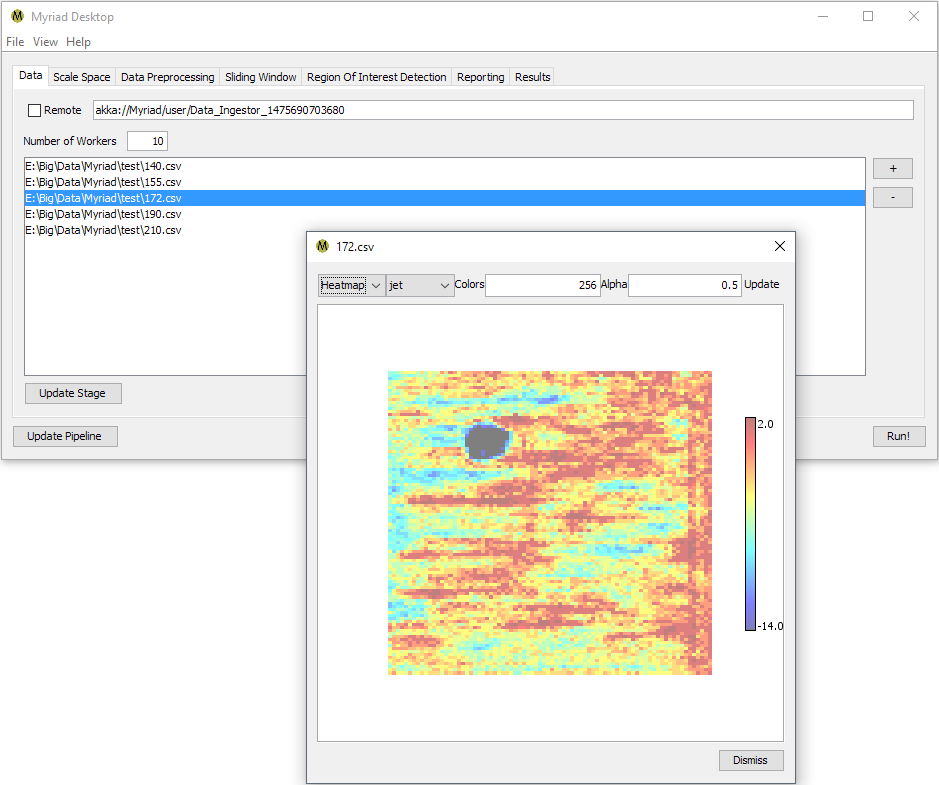
If you're using the Data Ingestion stage to acquire data, add one or more input files for ingestion by pressing the + button. Double-clicking on any file will attempt to load and display the data.
Once you've selected all the files you'd like to analyze in this run, press the Run! button. Desktop will attempt to read all of the data files specified and run their contents through your configured pipeline. Switch to the Results tab to monitor the tally of ROI as they are detected. Note that as an asynchronous operation there is no particular order to the ROI found.
When processing has completed, switch to the Results tab and press Compile Results. Desktop will organize all the reported ROI by input file, i.e.
becomes
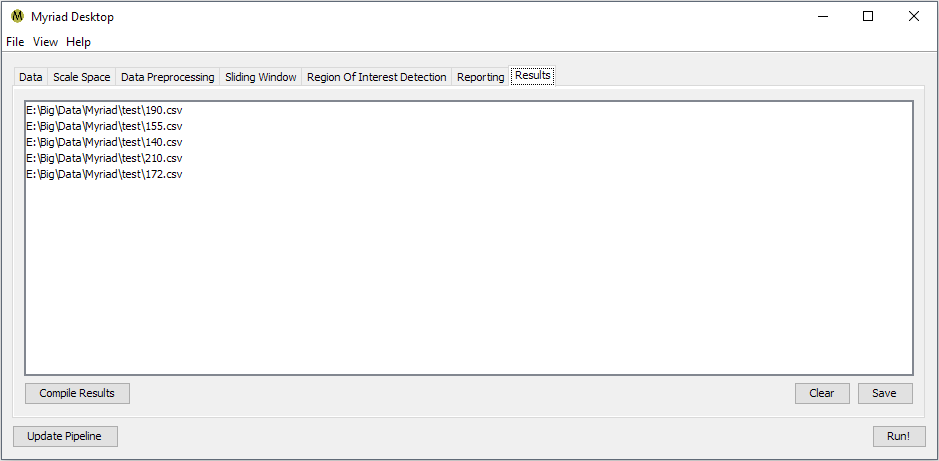
Double-clicking on any entry in the Results tab will bring up a list of available operations for displaying the ROI for a given input. Desktop uses the metadata within each ROI to identify the ROI's position within the original data. Depending on how you've configured your pipeline, a single ROI may be detected multiple times e.g. if your Sliding Windows overlap, the ROI is discernible at multiple scales, etc. A discussion of the currently-available display operations follows. These are presentation operations, i.e. the original list of ROI is not modified.
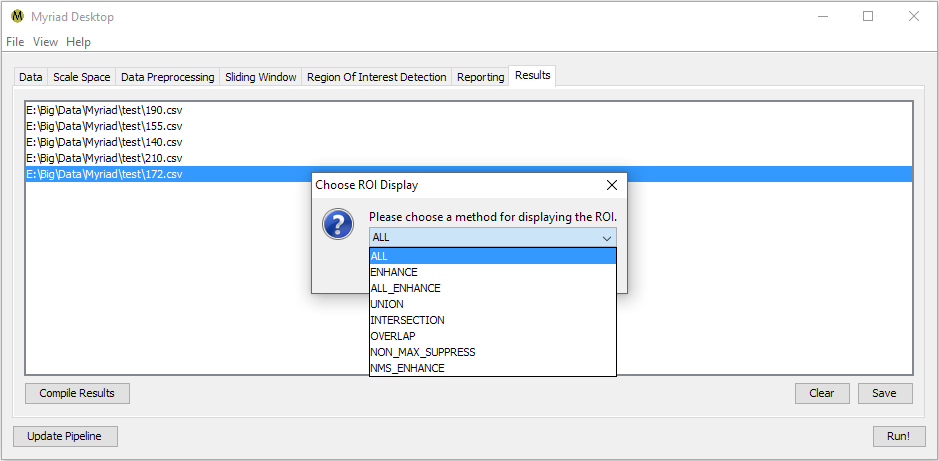
All ROI
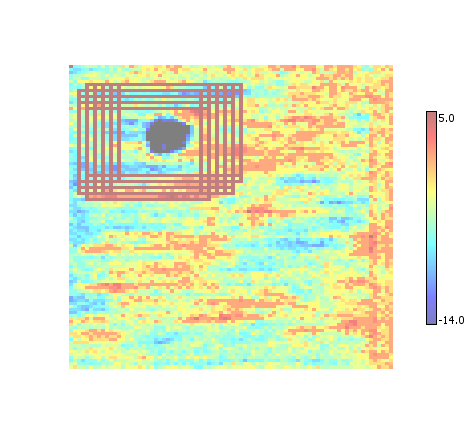
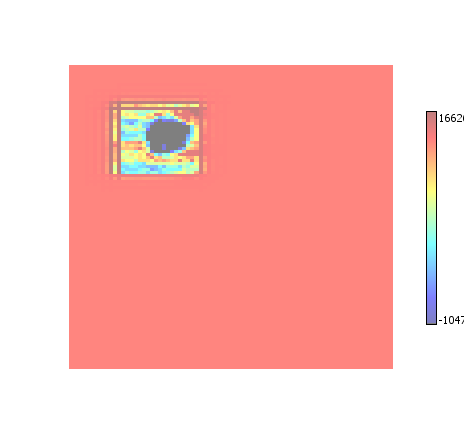
By default Desktop simply displays all the ROI that were found for the given input. Each ROI is indicated by a rectangular outline that is painted with the color corresponding to the maximum value in the dataset.
Enhance
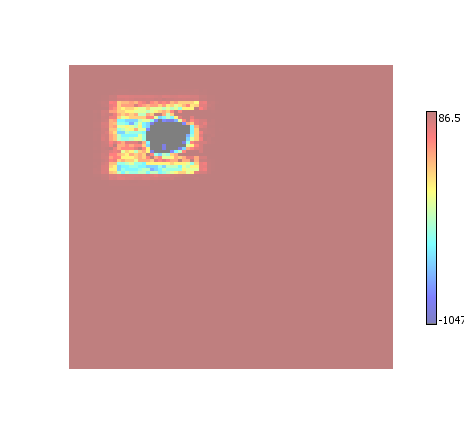
Every element within an ROI has its amplitude increased by a small amount. Elements that are within multiple ROI have their amplitudes increased multiple times. The end effect is a visual presentation of the confidence of an ROI classification - the more pronounced the data the more confident the ROI detector was in classifying it as ROI.
All-Enhance
A combination of All ROI and Enhance ROI.
Union
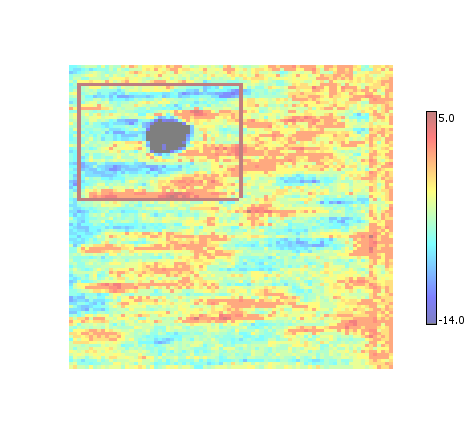
Replaces all overlapping ROI with a single bounding box that is the union of the overlapping ROI regions. Tends to produce the fewest final ROI regions, at the expense of creating regions that may be larger than necessary.
Intersection

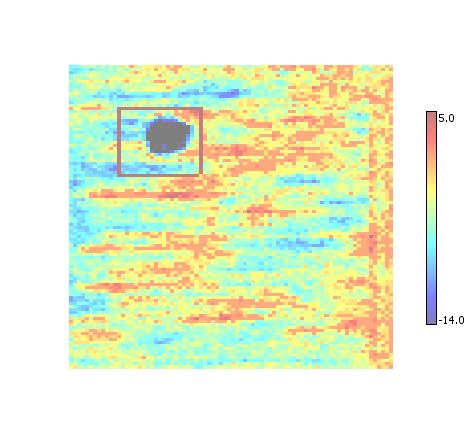
Replaces all overlapping ROI with a single bounding box that is the intersection of the overlapping ROI regions. Tends to produce the smallest ROI regions at the expense of creating more regions than necessary.
Overlap
Performs an intersection of overlapping ROI, provided they overlap by more than a set amount (currently 30%).
Non-Maximum Suppression (NMS)
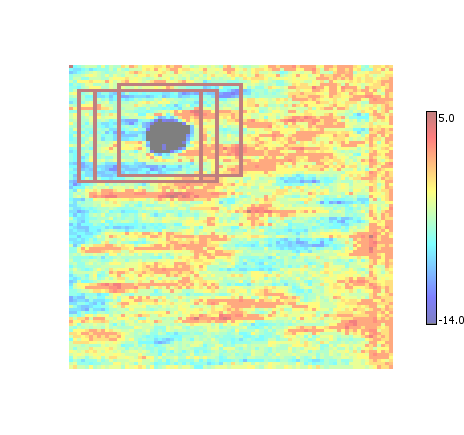
The list of ROI is thinned out by removing ("suppressing") those ROI that share significant overlap in a process sometimes referred to as non-maximum suppression. Tends to produce more / smaller ROI than union.
Enhanced Non-Maximum Suppression

A combination of non-maximum suppression and enhancement. As with conventional enhancement, tends to reduce background noise.
Saving Results
Individual Results
Datasets displayed in Desktop can be exported to disk as a conventional image. Double-click on an input file, ROI, or a compiled ROI result to display the data. For large datasets, Desktop will ask whether to display the dataset as-is or to attempt to subsample and scale.
Regardless of choice no permanent changes are made to the data; subsampling is used only to speed up display of the data.
To export the dataset, right-click anywhere on the dataset and select Save from the context menu. Desktop currently supports several image formats for exporting the data including BMP, JPG, GIF, TIFF, and PNG.
Batch Results
To save all of the results of an analysis, press the Save button on the Results tab. Desktop will prompt for a destination folder and a display preference (Union, NMS, etc.). Desktop will compile the final ROI results for each input file and export as a delimited text file in the specified folder.
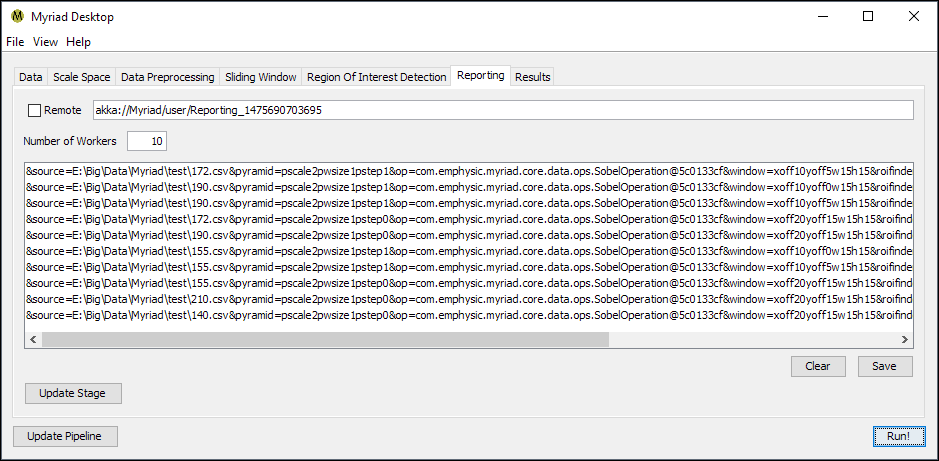
To save all the reported ROI, switch to the Reporting tab and press the Save button. Desktop will prompt for a destination file, and will write all the ROI results as text to this file. The text output is of the form
&source=E:\Big\Data\Myriad\test\190.csv&pyramid=pscale2pwsize1pstep1&op=com.emphysic.myriad.core.data.ops.SobelOperation@3cea4a82&window=xoff6yoff1w15h15&roifinder=com.emphysic.myriad.core.data.roi.PassiveAggressiveROIFinder@1ec9d294&roiorigin=0
&source=E:\Big\Data\Myriad\test\190.csv&pyramid=pscale2pwsize1pstep1&op=com.emphysic.myriad.core.data.ops.SobelOperation@3cea4a82&window=xoff6yoff2w15h15&roifinder=com.emphysic.myriad.core.data.roi.PassiveAggressiveROIFinder@1ec9d294&roiorigin=0
&source=E:\Big\Data\Myriad\test\190.csv&pyramid=pscale2pwsize1pstep1&op=com.emphysic.myriad.core.data.ops.SobelOperation@3cea4a82&window=xoff6yoff0w15h15&roifinder=com.emphysic.myriad.core.data.roi.PassiveAggressiveROIFinder@1ec9d294&roiorigin=0
&source=E:\Big\Data\Myriad\test\190.csv&pyramid=pscale2pwsize1pstep1&op=com.emphysic.myriad.core.data.ops.SobelOperation@3cea4a82&window=xoff4yoff3w15h15&roifinder=com.emphysic.myriad.core.data.roi.PassiveAggressiveROIFinder@1ec9d294&roiorigin=0
Where each line is a Region Of Interest, and includes information about the input file and the approximate position of the ROI within the input.
References
- Rauber, T. and Runger, G. Parallel Programming for Multicore and Cluster Systems (Second Edition), Section 6.1.7. Springer: New York, 2013.
- Iancu, Costin, et al. Oversubscription on multicore processors. Parallel & Distributed Processing (IPDPS), 2010 IEEE International Symposium on. IEEE, 2010.
- Angeles Navarro, Rafael Asenjo, Siham Tabik, and Calin Cascaval. Analytical Modeling of Pipeline Parallelism. In Proceedings of the 2009 18th International Conference on Parallel Architectures and Compilation Techniques (PACT '09).